

Higher education
Institutional research, teaching & learning centers, student affairs, survey administrators.
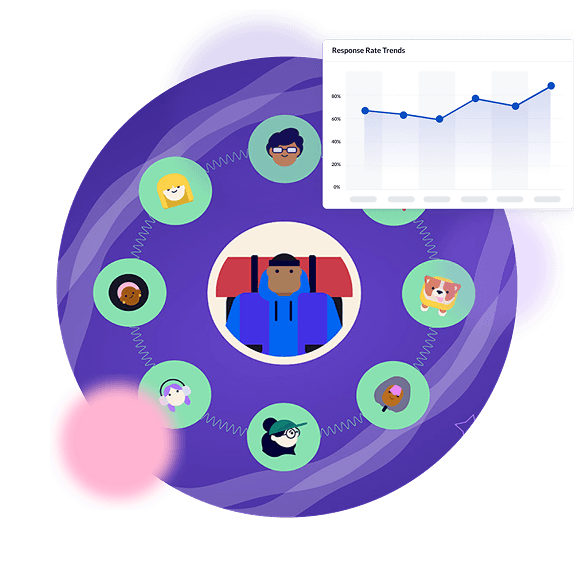
The Global Response Rates Tournament brings together survey leaders from the Explorance community to see how their engagement strategies rank on a global stage. Join the competition and contribute to a benchmark report that elevates student and employee feedback.
The Global Response Rates Tournament is designed for higher education, human resources, and corporate learning professionals who want to increase response rates for student, employee, or organizational surveys worldwide. This tournament is ideal for professionals in the following domains:
Institutional research, teaching & learning centers, student affairs, survey administrators.

HR, L&D, employee experience, organizational development, culture teams specializing in staff, faculty, and workplace culture.
Any organizational department or role that runs surveys and wants to improve engagement.
By sharing your survey results between March 1 and April 30, 2026, you’ll put your response rate strategies to the test and compete to win global recognition compared to your peers. You’ll also lend your voice to the Global Response Rate Benchmarking Report that will highlight trends, proven tactics, and results across a variety of participant segments.
Winner announcements and overall results will debut at Explorance World 2026.
High survey response rates encourage more trust and engagement across your campus or workplace, delivering benefits that include:

Students and employees are more likely to complete evaluations when you reach them through familiar channels at the right moment. Explorance's software solution gives you multiple delivery options so you can match your approach to how your audience already engages.
For higher education institutions, deliver surveys directly in Canvas, Blackboard, or Moodle, so students can respond without leaving their learning environment.

Schedule automated reminder emails that adjust timing or delivery based on survey recipient response behavior.

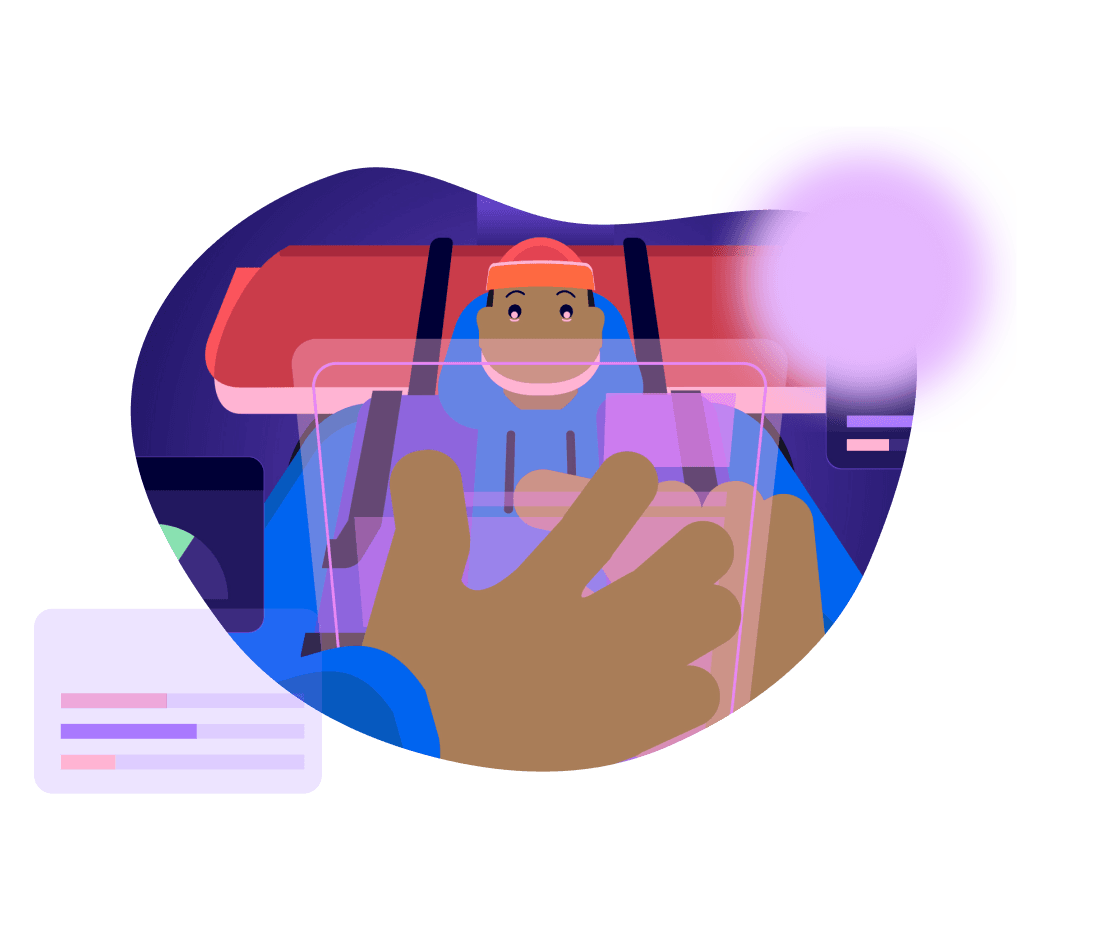
Replicate on-site paper response rates by letting students or employees scan a QR code and complete evaluations on their phones.

Send text message reminders that reach survey recipients directly on the devices they use most.

Offer entry into a prize drawing or a small reward to encourage respondents to complete their surveys before the deadline.


The process is straightforward for both higher ed institutions and corporate environments.

Complete the registration form on this page once. You'll receive a confirmation email with next steps, including the link to the form you'll use to submit your survey response rate(s).
Run your surveys using your existing Blue, BlueX, or Metrics That Matter (MTM) setup. Track your response rates internally.
Fill out the tournament response rates form. Add your response rate(s) screenshot(s) and submit. You can submit as many times as you want.
View category leaderboards to see where you stand. Rankings update throughout the tournament.
The process is straightforward for both higher ed institutions and corporate environments.

Complete the registration form on this page once. You'll receive a confirmation email with next steps, including the link to the form you'll use to submit your survey response rate(s).

Run your surveys using your existing Blue, BlueX, or Metrics That Matter (MTM) setup. Track your response rates internally.

Fill out the tournament response rates form. Add your response rate(s) screenshot(s) and submit. You can submit as many times as you want.

View category leaderboards to see where you stand. Rankings update throughout the tournament.
Get your tickets to the only conference dedicated exclusively to feedback analytics and its strategic place within organizations. Highly rated for its thought leadership content and hands-on sessions, attendees gain knowledge crucial to their roles and can apply it quickly and effectively in their day-to-day.
Whether you run student surveys or employee engagement programs, your organization competes in categories tailored to your context. We analyze your results based on response rate percentage, response counts, and survey audience size. Then, we normalize the data to produce fair rankings across different organization sizes and survey types.


At the end of the tournament, participants receive access to the Global Response Rates Benchmark Report, a data-driven publication built entirely from aggregated tournament results.
The report will include:
Make sure you get your copy of this resource by pre-saving it today.

By lending your voice to this benchmarking event, you'll discover:
These learning outcomes will strengthen your programs long after the tournament ends.
Organizations can rest assured that this tournament collects only response rate summaries, not individual responses or survey content. All data is aggregated, anonymized, and benchmarked alongside organizations of similar size, region, and vertical.
Explorance adheres to strict data protection standards to ensure that no identifiable participant-level data is collected or shared. Your rankings remain secure and benchmarking insights remain fair and context-aware.

Any other questions?

The tournament is designed for Explorance customers using any of the solutions that make up the Feedback Analytics Suite.
Yes. Only aggregated response rate summaries are used. No personal or survey-level content is collected.
The Global Response Rates Tournament dashboards are regularly updated throughout the event window.
You qualify for a tournament badge when you hit milestones such as response rates over 50% or 70%, Regional Champion, Most Improved, or winning a category.
You can participate in the event using any surveys you run during the designated event timeframe.
The year's winners will be announced at Explorance World 2026, with full recognition across digital channels. More in-depth benchmarks will follow during Fall 2026 via the full results report.


'%3e%3cpath%20d='M5.83968%2010.4004L7.09855%2015.7752L1.29959%2021.5843L1.23852%2021.642C1.21137%2021.6692%201.18762%2021.6997%201.16047%2021.7235C0.481112%2022.4372%200.0747675%2023.3674%200.0127211%2024.3508C-0.0493254%2025.3343%200.236888%2026.3082%200.821155%2027.1016C0.885626%2027.1865%200.950095%2027.2713%201.01796%2027.3493C1.0306%2027.3649%201.0442%2027.3796%201.05868%2027.3935C1.16422%2027.5192%201.27755%2027.6382%201.398%2027.7497L1.4455%2027.7939L1.67624%2028.0246L9.14125%2035.4896L20.0334%2024.6043L5.83968%2010.4004Z'%20fill='white'/%3e%3cpath%20d='M13.1078%2039.4493L9.78247%2042.761L15.1539%2041.5055L20.98%2047.3113L21.0411%2047.369L21.1225%2047.4504C21.8375%2048.1288%2022.7681%2048.5345%2023.7517%2048.5965C24.7354%2048.6585%2025.7096%2048.373%2026.5041%2047.7897C26.5889%2047.7253%2026.6737%2047.6608%2026.7518%2047.5929L26.7959%2047.5522C26.9233%2047.4401%2027.0434%2047.3199%2027.1556%2047.1925C27.1709%2047.1795%2027.1845%2047.1647%2027.1963%2047.1484L27.4304%2046.9211L34.8954%2039.4561L23.9999%2028.5605L13.1078%2039.4493Z'%20fill='white'/%3e%3cpath%20d='M34.8921%209.76194L38.2072%206.45019L32.8358%207.70228L27.0199%201.89315L26.9588%201.83207C26.9317%201.80492%2026.9045%201.78117%2026.8808%201.75403C26.1658%201.07561%2025.2352%200.669967%2024.2515%200.607946C23.2679%200.545924%2022.2937%200.831473%2021.4992%201.41471L21.2515%201.61491L21.204%201.65902C21.0833%201.7643%2020.9699%201.87767%2020.8646%201.99833L20.8239%202.04245L20.5932%202.2664L13.1282%209.73141L23.9999%2020.6473L34.8921%209.76194Z'%20fill='white'/%3e%3cpath%20d='M47.1789%2022.1067C47.1181%2022.0204%2047.0524%2021.9377%2046.9821%2021.859L46.9414%2021.8149C46.8301%2021.6867%2046.7099%2021.5665%2046.5817%2021.4552L46.5376%2021.4145L46.3069%2021.1838L38.8419%2013.7188L27.9531%2024.6041L38.8419%2035.4928L42.157%2038.8046L40.9015%2033.4332L46.7073%2027.624L46.7683%2027.5663L46.8464%2027.4815C47.5267%2026.769%2047.9337%2025.8392%2047.9958%2024.856C48.0579%2023.8727%2047.771%2022.8992%2047.1857%2022.1067H47.1789Z'%20fill='%230050C1'/%3e%3c/g%3e%3cdefs%3e%3cclipPath%20id='clip0_6641_12689'%3e%3crect%20width='48'%20height='47.9966'%20fill='white'%20transform='translate(0%200.603516)'/%3e%3c/clipPath%3e%3c/defs%3e%3c/svg%3e)